Chapters
Guide › Manage the business
Dashboard and reports
The dashboard shows how today is going while service runs. The reports answer questions about any dates you choose: what you sold, when, which dishes earn their place, how each person did, where money left the till and how fast the kitchen worked. Every table exports to a spreadsheet. This chapter is for owners and managers.
Before you start
- Your role needs Open the back office and View reports. A new restaurant gives both to the Owner and Manager roles. See Your team, roles and PINs.
- Reports are only as good as what staff record. Make sure orders are paid on Sofrito, voids and discounts carry a reason, and the kitchen bumps tickets on the kitchen display.
Know how Sofrito counts
A few rules apply to the dashboard and to every report:
- Paid orders only. An order counts in sales once it is paid in full. Checks still open show on the dashboard as open orders, not as sales.
- The business day. A day runs from the cut-off hour to the cut-off hour, not from midnight. With the usual cut-off of 04:00, a bill paid at 01:30 belongs to the evening before. You set the cut-off in Settings › Language and region › Business day ends at. Every date in the reports is a business day. When the day is closed with a Z report before the cut-off, sales from then on belong to the next business day.
- Tips are counted apart. Tips are shown on their own, because they belong to the team. Service charges marked Counts as a tip are tips too: they are counted once, with the tips, and not as sales or service charges.
- Voids are items sent to the kitchen and then removed. An item taken off an order before it was sent is not a void and is not counted anywhere. A void counts on the business day it was made, even when its check is still open or moves on to the next day.
- Refunds count on the day of the refund, not on the day of the original sale.
- Gift cards and house accounts are not sales. Money taken for a gift card, or paid off a house account, is shown on its own. The sale counts when the card or the account pays for an order.
Check how today is going
- In the back office, select Dashboard.
The dashboard opens with the restaurant's name and today's business day. After the day is closed early with a Z report, "today" is already the next business day. The dashboard refreshes by itself every 30 seconds, so you can leave it open on a screen in the office.
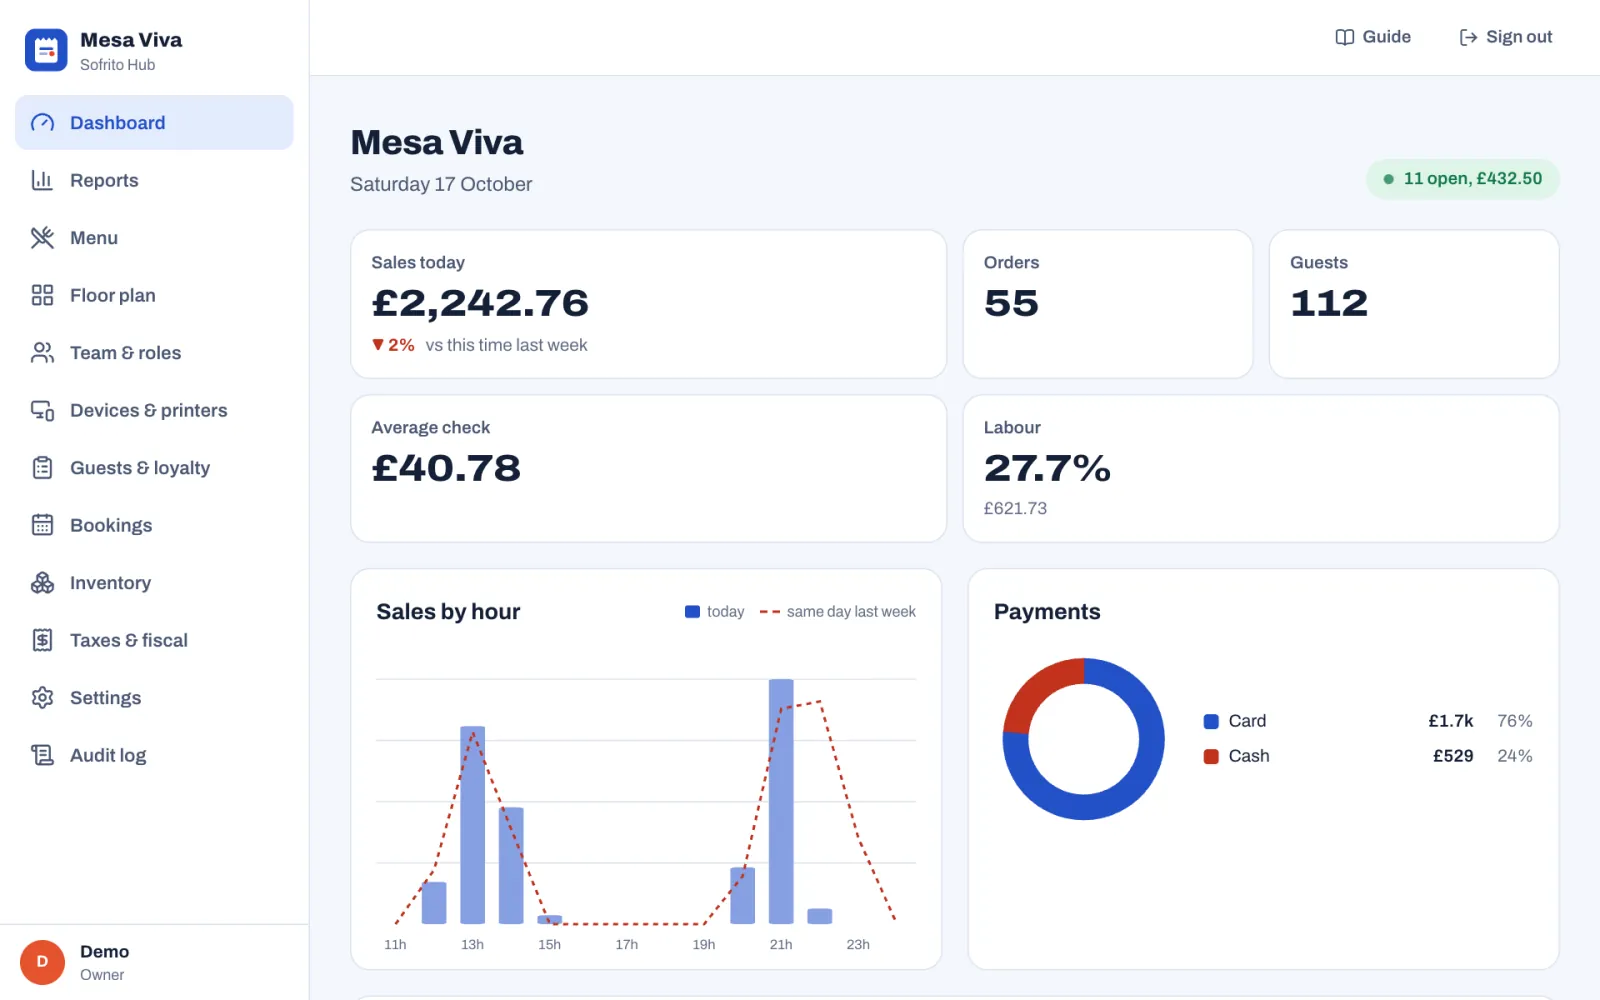
| Figure | What it shows |
|---|---|
| {n} open, {amount} (the green badge) | How many orders are open right now and what they add up to. This money is not in sales yet. |
| Sales today | What guests have paid today, with tax and service charges, without tips, after refunds. The arrow compares it with the same day last week up to the same time of day, so a Friday at 21:00 is compared with last Friday at 21:00. |
| Orders | How many orders were paid today. |
| Guests | The guest counts staff entered on today's paid orders. |
| Average check | The average paid order: what today's paid orders came to, divided by how many there were. |
| Labour | Today's labour cost as a share of today's sales. The amount under it is the cost: hours clocked today, including people still on the clock, times each person's hourly wage, without unpaid breaks. |
| Sales by hour | Today's sales by the hour each order was paid (bars), and the same day last week (dashed line), in the order of the business day: hours after midnight come after the evening. |
| Payments | How today's money was taken, by payment method. |
Scroll down for the rest of the day's picture.
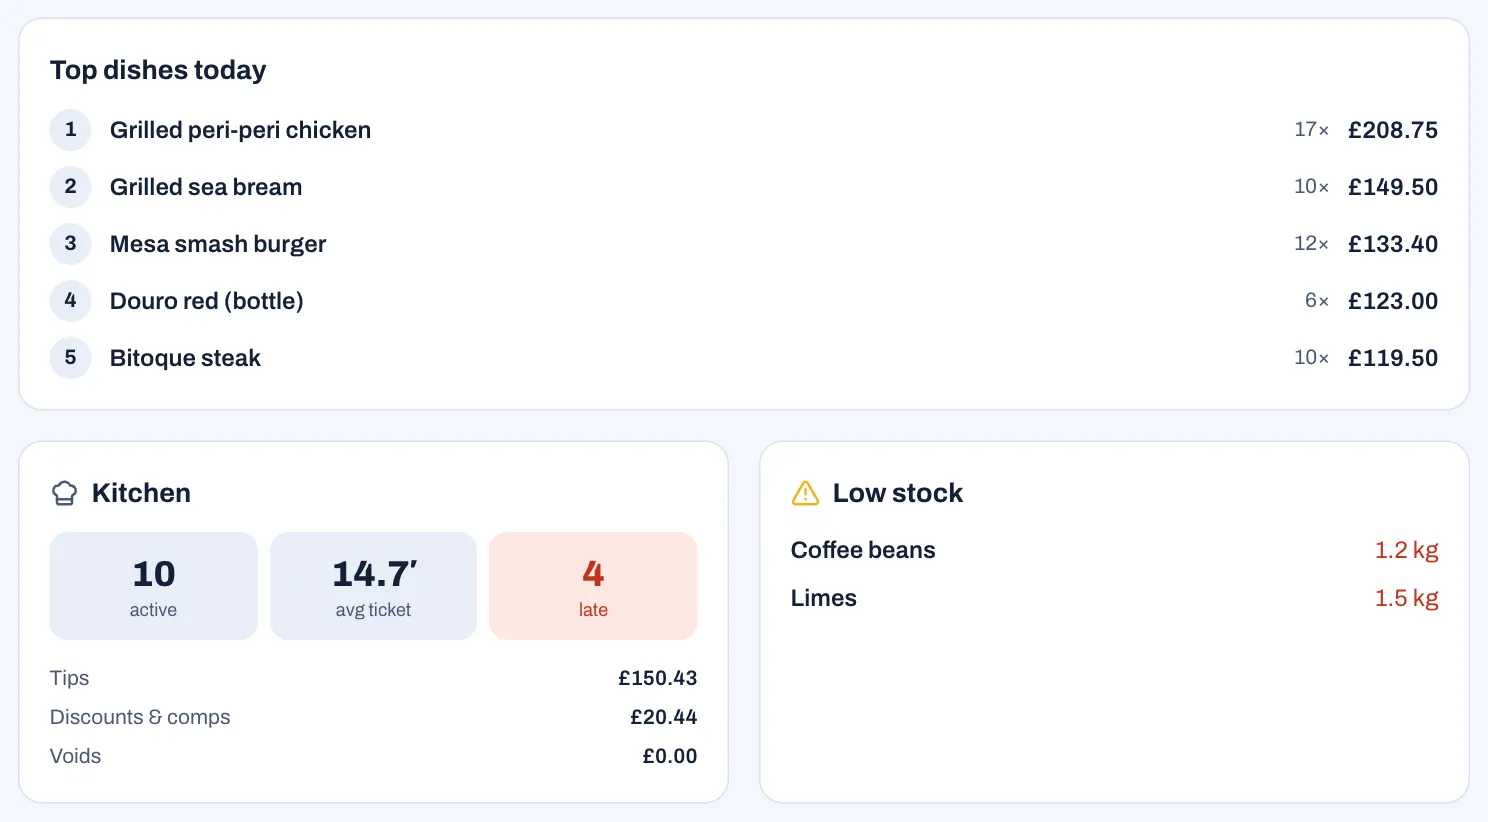
| Figure | What it shows |
|---|---|
| Top dishes today | The five dishes that brought in the most money today, after discounts, with how many sold. |
| Kitchen: active | Tickets on the kitchen screens right now. |
| Kitchen: avg ticket | Today's average time, in minutes, from a ticket reaching its station until the kitchen marked it ready. |
| Kitchen: late | Tickets on the screens now that have waited longer than the late time in Settings › Kitchen. The box turns red when there are any. |
| Tips | Tips on today's paid orders, with the service charges that count as a tip. |
| Discounts & comps | Money given away today in discounts and free items, on paid orders. |
| Voids | The menu value of items sent to the kitchen and then voided today, on any order, open or closed. |
| Low stock | Up to six stock items at or below their reorder point. "Stock levels are healthy." means there are none. See Stock, recipes and suppliers. |
Choose the dates for a report
- In the back office, select Reports.
- Choose the dates: Today, Yesterday, Last 7 days, Last 30 days or This month. For other dates, type them in the two date boxes.
- Select the tab with your question: Summary, Sales by day, By hour, Items & categories, Staff, Exceptions or Kitchen.
Reports open on the last 7 days. The tab and the dates stay in the page address, so you can bookmark a report or send its link to another manager.
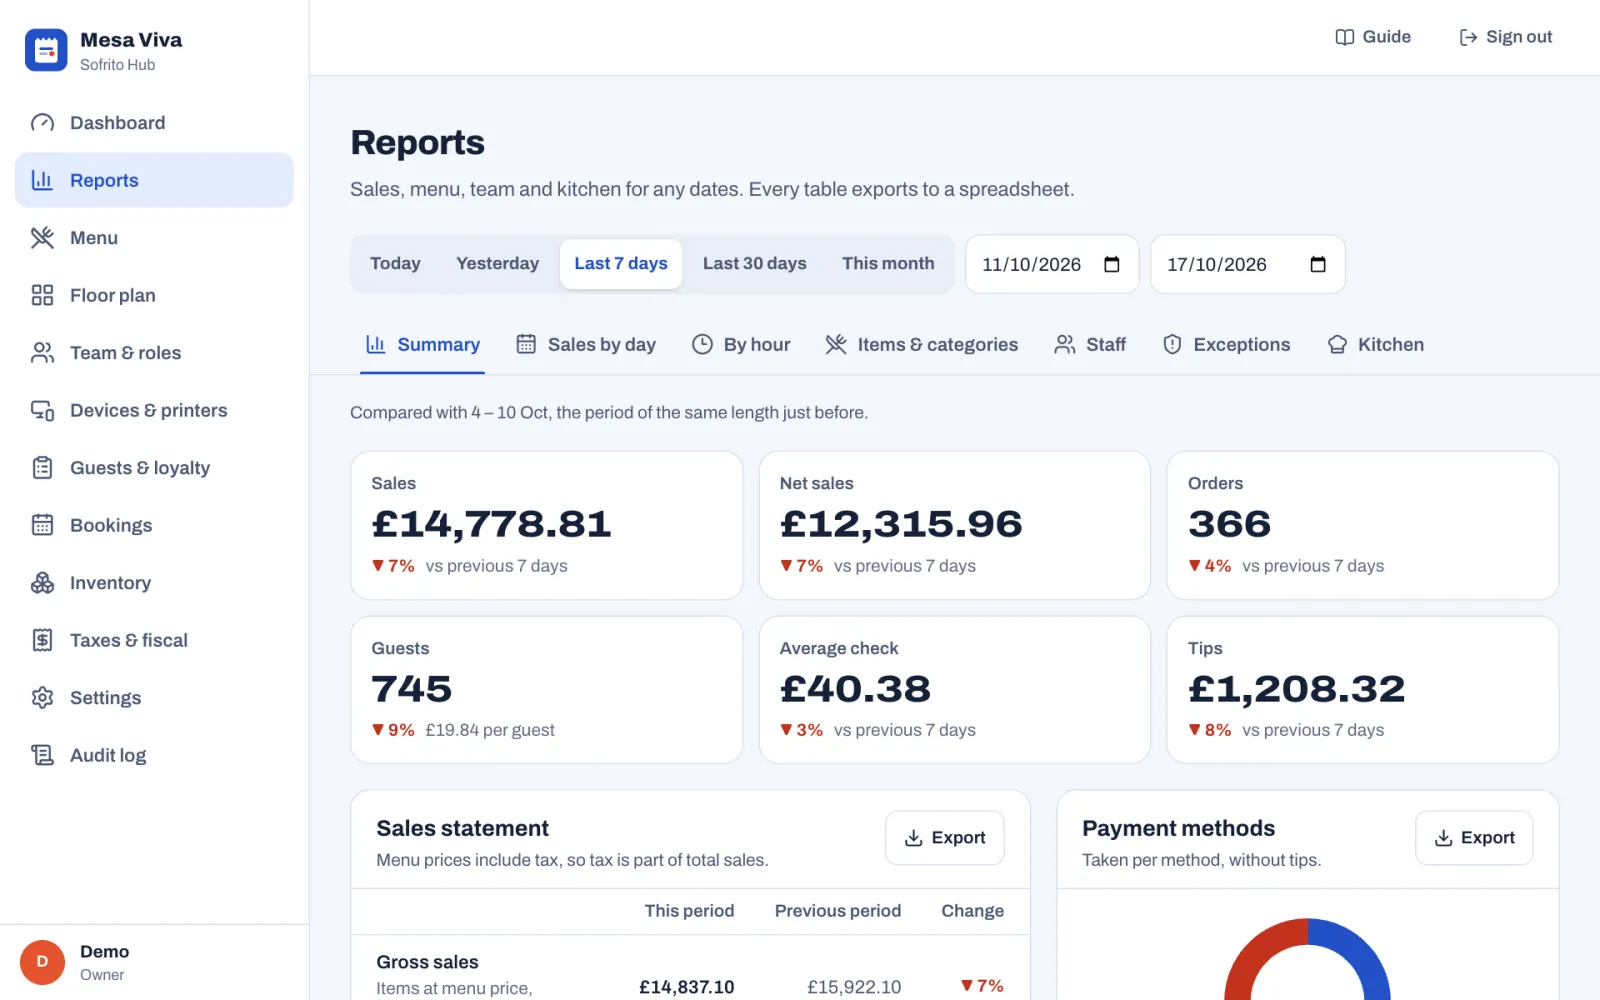
The tiles on Summary and the sales statement compare your dates with the period of the same length just before. A green arrow means better, red means worse. In the sales statement, discounts, comps, refunds and voids work the other way round: less is better, so a fall shows in green.
Export a report to a spreadsheet
Every table has an Export button at its top right.
- Open the report and choose the dates.
- To change the order of the rows, select a column heading. Select it again to reverse the order.
- Select Export.
Your browser downloads a CSV file that opens in Excel, Numbers or Google Sheets. The file holds exactly what the table shows, in the same order, with a Total row where the table has one. Money columns name the currency in their heading, for example "Sales (GBP)". The file name says what it is and which dates it covers, for example sales-by-day_2026-10-10_2026-10-16.csv.
To keep a copy of everything at once, select Settings › Account, then Everything, as CSV files. It downloads one ZIP file with your menu, orders, payments, team, time cards, guests, gift cards and stock, as CSV files. The button only shows when your role has Export data.
See what you sold
Select Reports › Summary. It answers "How much did we sell, and where did the money come from?"
The six tiles at the top are Sales, Net sales, Orders, Guests (with the spend per guest), Average check and Tips, each against the previous period.
The Sales statement walks from the menu value of what you sold to what guests paid. Its first line under the heading says whether your menu prices include tax.
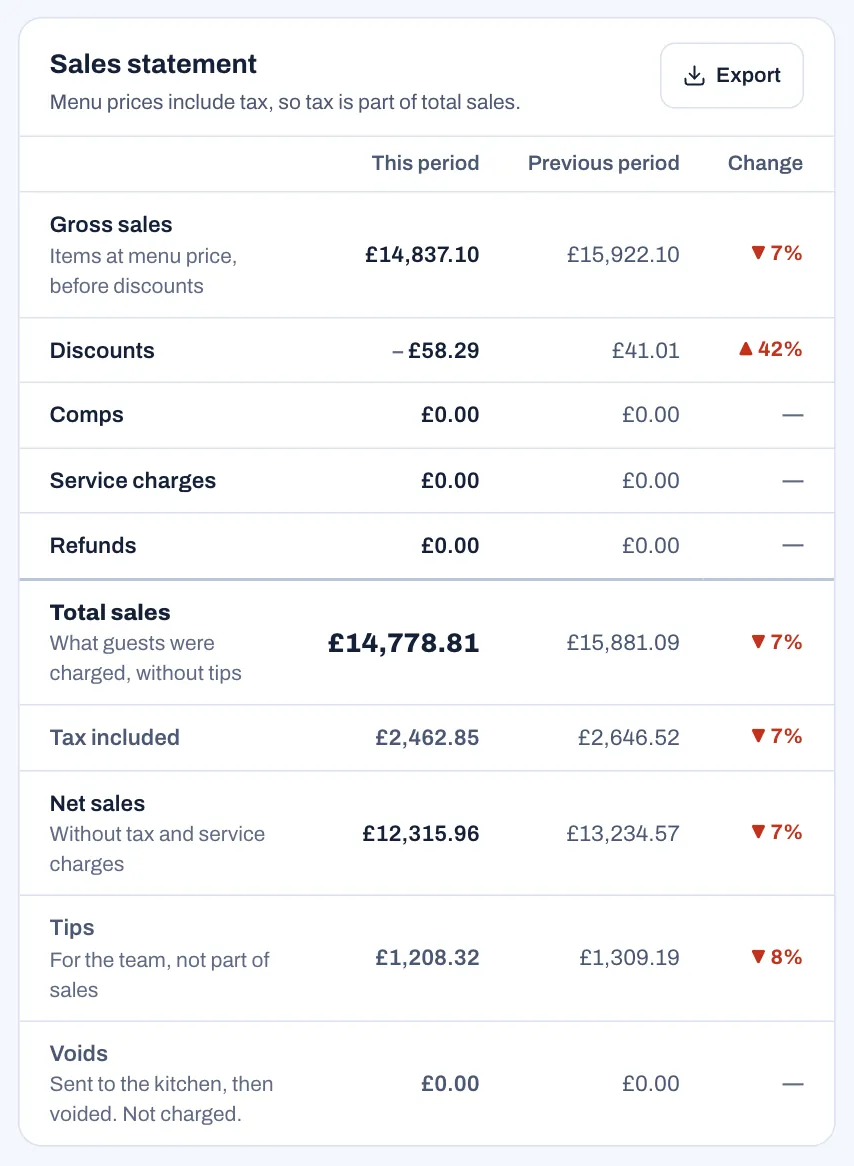
| Line | What it means |
|---|---|
| Gross sales | Items at menu price, before discounts. |
| Discounts | Discounts given on paid orders, without comps. |
| Comps | The menu value of items given on the house. |
| Service charges | Service charges added to bills, without the ones that count as a tip. |
| Tax | Only when tax is added at payment: the tax added to bills. |
| Refunds | Money given back to guests in these dates. |
| Total sales | What guests were charged, without tips. This is the Sales tile. |
| Tax included | Only when menu prices include tax: the tax inside total sales. |
| Net sales | Total sales without tax and service charges. |
| Tips | For the team, not part of sales: tips added to payments, and service charges that count as a tip. |
| Voids | Items sent to the kitchen, then voided. Not charged. |
Below the statement:
- Payment methods shows how the money was taken, as a ring and a table: Method, Payments (how many), Amount, Tips and Share. Amounts are without tips. The printed X and Z reports, and the Cash screen on the till, list Payments, tips included, so their amounts are higher by the tips.
- Gift cards and house accounts appears when gift cards were sold or house accounts paid in these dates: Gift cards sold and House accounts paid, by Method, with Payments and Amount. This money is not a sale, but it went into the drawer or through the card terminal: count it with the payments when you check them.
- Order types splits sales between dine in, takeaway, delivery, bar tabs and counter: Orders, Sales, Average check and Share.
- Tax breakdown shows, for each tax rate, the Taxable base, the Tax and the Total with tax, as on your fiscal documents. Send this table to your accountant with the fiscal files.
The Export button on the sales statement downloads it with both periods and the change.
Compare days
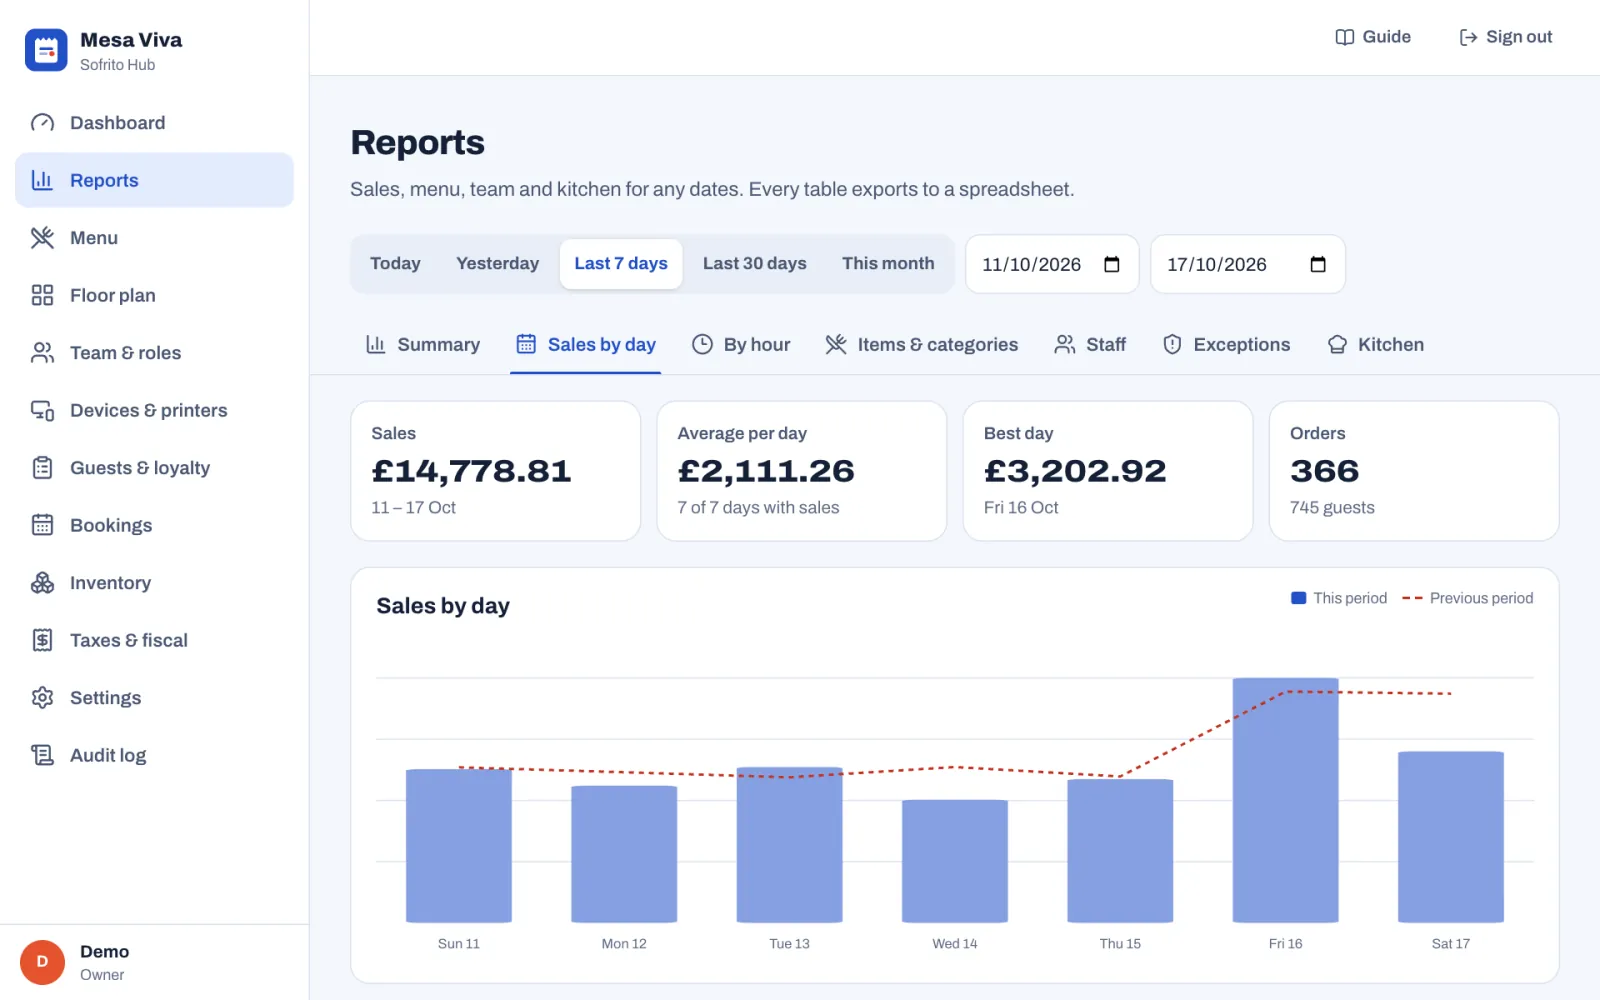
Select Reports › Sales by day. It answers "Which days are strong, and how does this period compare with the last?"
- Sales for the whole period.
- Average per day, counting only days with sales, and how many days that was, for example "7 of 7 days with sales".
- Best day and its date.
- Orders, with the number of guests under it.
The chart shows each day's sales as bars, with the previous period as a dashed line. The Day by day table lists every day, including days with no sales: Date, Orders, Guests, Sales, Net sales and Average check.
Find your busy hours
Select Reports › By hour. It answers "When are we busy, and when are we not?"
- Top hour for sales and Top hour for orders.
- Hours with sales: how many hours of the day had at least one sale.
- A strip of 24 boxes, one per hour of the business day. The darker the box, the more you sold.
- A bar chart of the hours you were open, with the previous period as a dashed line.
- The Hour by hour table: Hour, Orders, Sales, Average check and Share of the day.
Each order counts in the hour it was paid, not the hour it was opened. The strip, the chart and the table follow the business day: they start at the cut-off hour in Settings › Language and region › Business day ends at, so sales after midnight come after the evening, at the end of the day they belong to.
Use this report with Team & roles › Timesheets to put people on the floor when the guests are there.
See which dishes earn their place
Select Reports › Items & categories. It answers "Which dishes sell, which make money, and which should change?" Choose Items or Categories at the top.
On Items, the Menu engineering panel sorts every dish into a group. Each dish is compared with the others in its own category. Categories with fewer than three dishes are compared with the whole menu.
- A dish is popular when it sold at least 70% of an even share of its category's units. For example, in a category of 10 dishes that sold 1,000 portions, an even share is 100, so a dish needs 70 to be popular.
- A dish is profitable when its margin per portion (price without tax, minus cost) is at or above the average for its category.
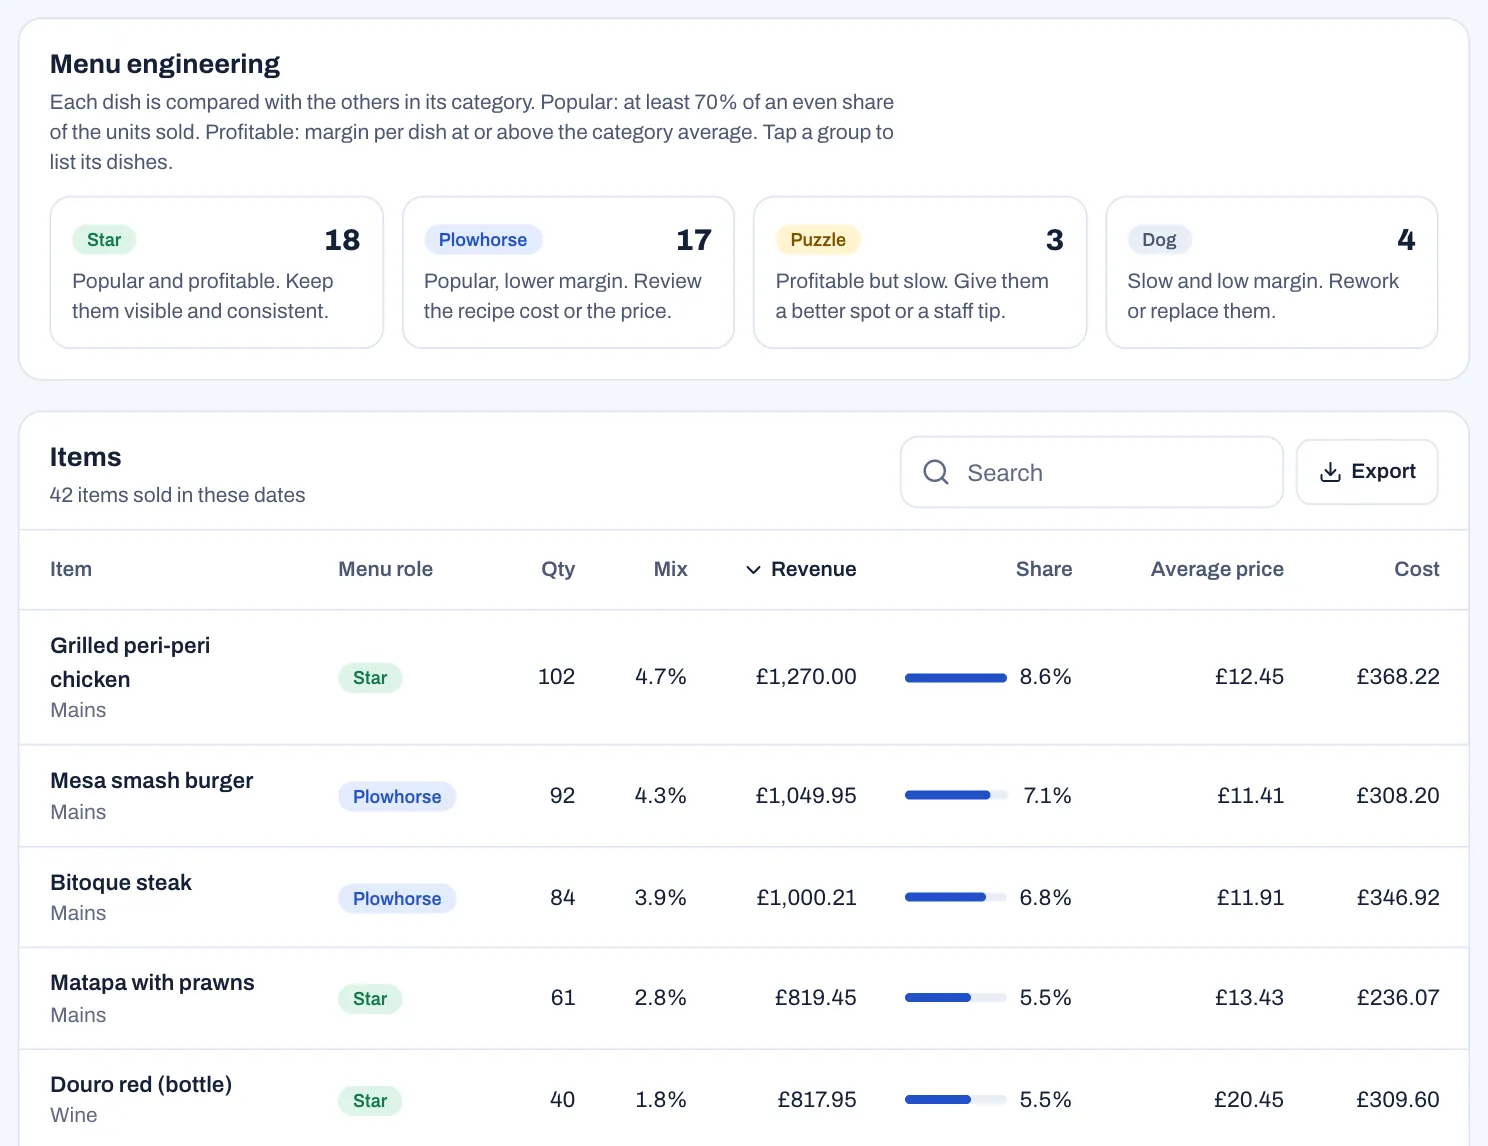
| Group | Means | What to do |
|---|---|---|
| Star | Popular and profitable. | Keep them visible and consistent. |
| Plowhorse | Popular, lower margin. | Review the recipe cost or the price. |
| Puzzle | Profitable but slow. | Give them a better spot or a staff tip. |
| Dog | Slow and low margin. | Rework or replace them. |
Select a group to list only its dishes. Select it again to show them all.
Margins need costs. A dish gets its cost from Cost to make in the menu (see Build your menu) or from its recipe, and the options chosen on it add the cost of their own recipes (see Stock, recipes and suppliers). When no dish has a cost, the panel only splits dishes into Popular and Slow seller. When some dishes have no cost, the panel says how many.
The Items table shows, for each dish: Menu role, Qty, Mix (its share of all units sold), Revenue (after discounts), Share (of revenue) and Average price. When dishes have costs, it adds Cost, Margin and Margin %. Type in Search to find a dish or a category. The export also includes the category.
On Categories, the tiles show the Top category, how many Categories sold and how many Items sold. The table lists each category's Qty, Revenue and Share.
Check each person's sales
Select Reports › Staff. It answers "How did each person do?"
- Top seller and their sales.
- Highest average check, among people with at least 5 orders.
- Tips, with how many people shared them.
The table shows, for each person: Orders, Guests, Sales, Average check, Tips, Discounts, Comps and Voids. The number in brackets after voids is how many items they voided. Everything counts on the orders each person owned, so an order handed over to another server counts for the person who had it at the end. On a narrow screen, swipe the table sideways to see every column.
Check voids, comps and discounts
Select Reports › Exceptions. It answers "Where did money leave the till, who did it, and who approved it?" This is the report to read every morning.
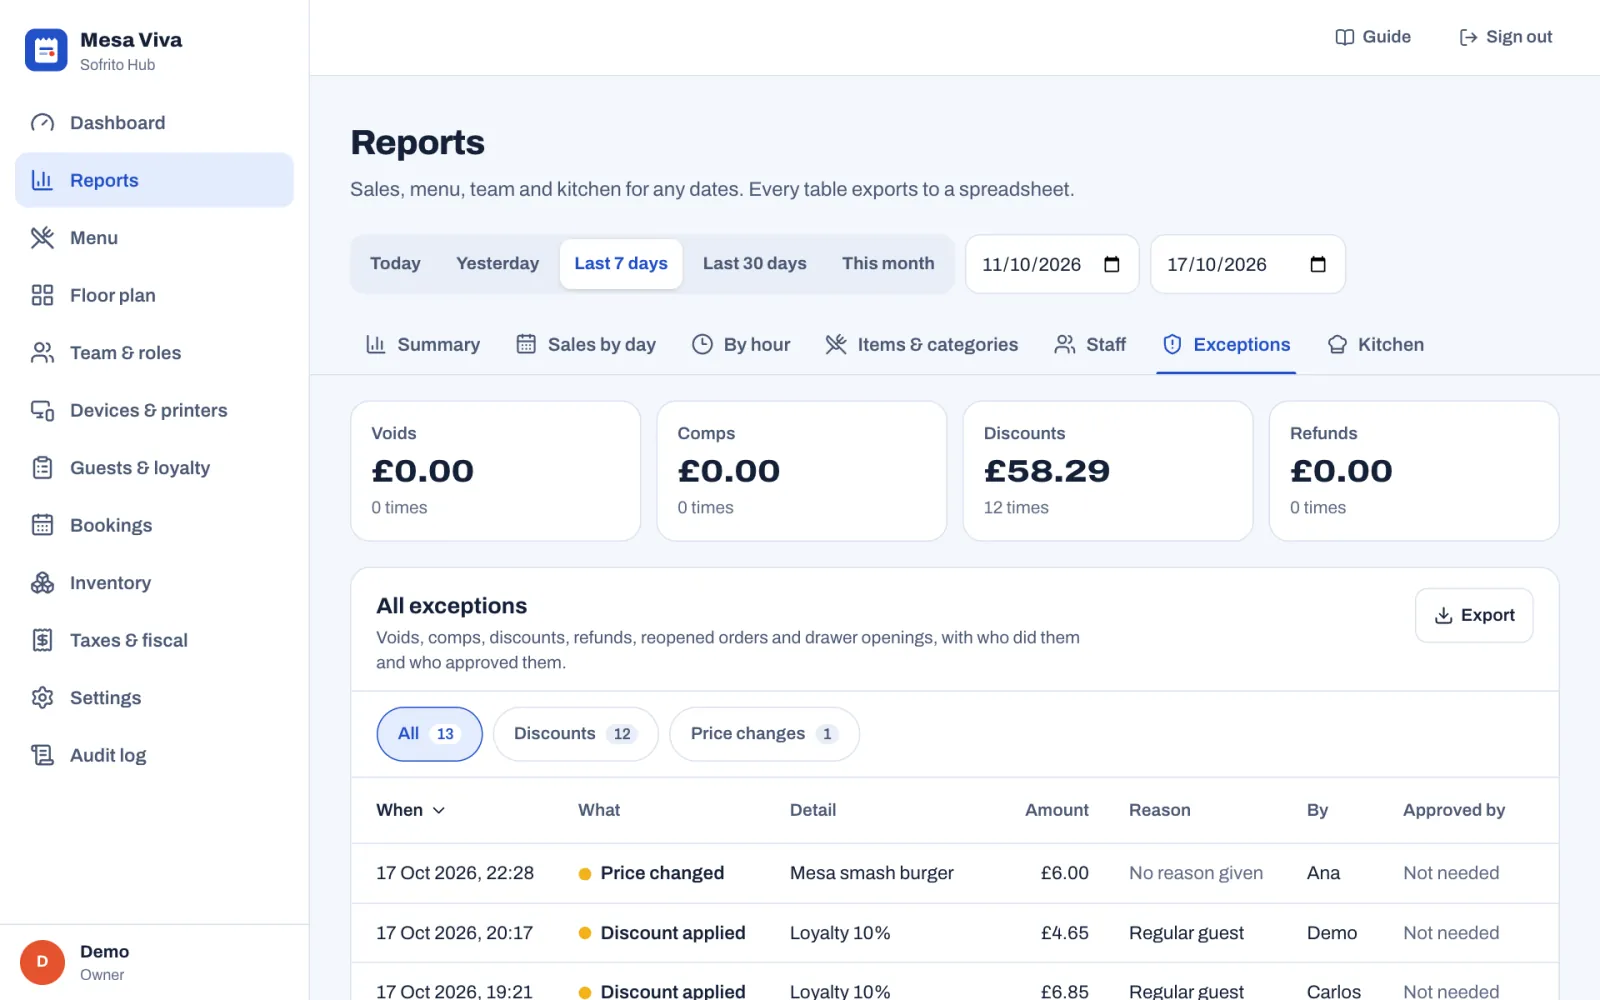
- The four tiles add up Voids, Comps, Discounts and Refunds, and say how many times each happened. Select a tile to list only those.
- All exceptions lists every void, comp, discount, price change, refund, voided payment, reopened order, drawer opened without a sale and cash pay-out. Use the buttons above the list (All, Voids, Comps, Discounts, Price changes, Refunds, Voided payments, Reopened orders, Cash drawer) to narrow it down. A button only shows when the dates have that kind of exception.
- Each row shows When, What, Detail (the item, order number or payment method), Amount, Reason, By (who did it) and Approved by. For a price change, the amount is the old price minus the new one, times the quantity. Not needed means the person's role allowed it without a manager. No reason given means nobody chose a reason.
- By employee counts, for each person, how many exceptions they made and for how much.
Exceptions appear the moment they happen, even on orders that are still open. The list shows the latest 500. If you reach that, choose fewer days.
Check kitchen speed
Select Reports › Kitchen. It answers "How long do guests wait for their food?"
- Tickets: how many tickets the stations finished on a kitchen screen.
- Average ticket time, with your target under it ("Aim for under 10 min").
- Late tickets, with the late time under it ("Late after 20 min"), and Share late.
Average ticket time by station draws one bar per station. A bar turns amber over the warning time and red over the late time, which is the dashed line. The Stations table lists Tickets, Average (min), Late and Late share for each station.
A ticket's time runs from the moment it reaches the station until the kitchen marks it ready. Only tickets finished on a kitchen screen are timed: tickets that only print, at stations no kitchen screen shows, are not. You set the warning and late times in Settings › Kitchen (see Settings, section by section). For the kitchen display itself, see The kitchen display.
When to look at what
| When | Look at | Why |
|---|---|---|
| During service | Dashboard | Open orders, late tickets and how today compares with last week. |
| Every morning | Reports › Exceptions for Yesterday | Every void, comp, discount, price change and refund, with who did it and why. |
| Every morning | The day close (Z report) | That the day was closed and the drawers balanced. See Close the day. |
| Every week | Summary and Sales by day for Last 7 days | Sales against the week before, and your strong and weak days. |
| Every week | By hour and Staff | Whether the rota matches the busy hours, and how each person did. |
| Every week | Kitchen | Whether ticket times are slipping, and at which station. |
| Every month | Summary for This month | The month's sales statement, payment methods and tax breakdown for your accountant. Export them. |
| Every month | Items & categories | Which dishes to promote, reprice, rework or drop. |
| Every month | Taxes & fiscal › Exports | The fiscal files your country asks for. See Taxes, receipts and legal documents. |